
Pigeon Clock Graph
By Lucy Stevens
2012
Lucy Stevens
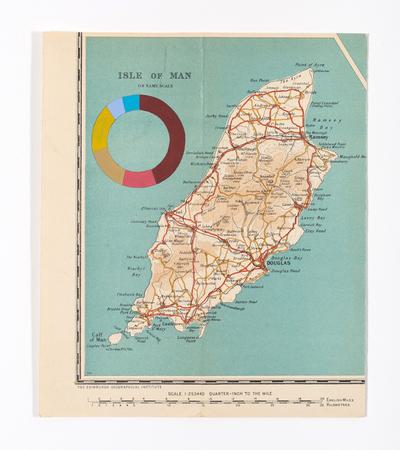
This year Stevens has explored the use of visuals to interpret a year’s worth of data based on feral pigeon behaviour, to support Cornell Laboratory of Ornithology with research into why pigeons exist in so many colour variations. Between 2010 – 2011 Stevens observed and fed pigeons in Leicester every Wednesday, counting and recording the colours of courting pigeons to support scientific research.
Pigeon clock graph shows the average number of pigeons per month over a year and the shape is based on the idea of a concentric circle graph. The image was layered using toulet clock faces from an automatic pigeon clock, used for pigeon racing.


Join Axis
We support artists
Funding, visibility, connection and practical help.
Membership includes £15 million of Public Liability Insurance!