
Pigeon feather pie chart
By Lucy Stevens
2013
Lucy Stevens
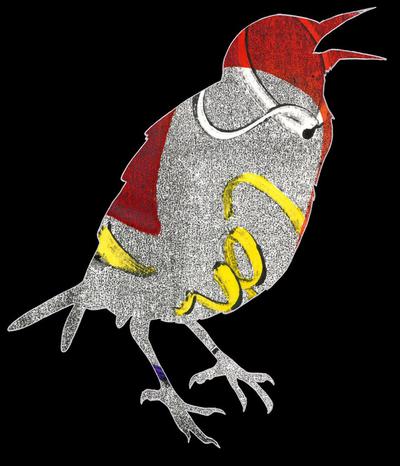
Pigeon Feather Pie Chart is the second visual interpretation that has come from a year of observing and collecting data on feral pigeons in Leicester (between 2010 – 2011), to support Cornell Laboratory of Ornithology with research into why pigeons exist in so many colour variations, in their project ‘Project Pigeon Watch’.
The digital print shows the average pigeon colour morph (varieties of feather colour) of pigeons observed over a year, to create a pie chart using pigeon feathers. The bright red imagery is taken from an early stamp created for the Pigeon-Gram service on the Great Barrier Island (New Zealand), produced when the Pigeon Post service began between the island and Auckland in 1897.


Join Axis
We support artists
Funding, visibility, connection and practical help.
Membership includes £15 million of Public Liability Insurance!